Tyk Cloud Monitor Metrics
This section explains the various metrics that are monitored by Tyk Cloud.Tyk Cloud Throughput
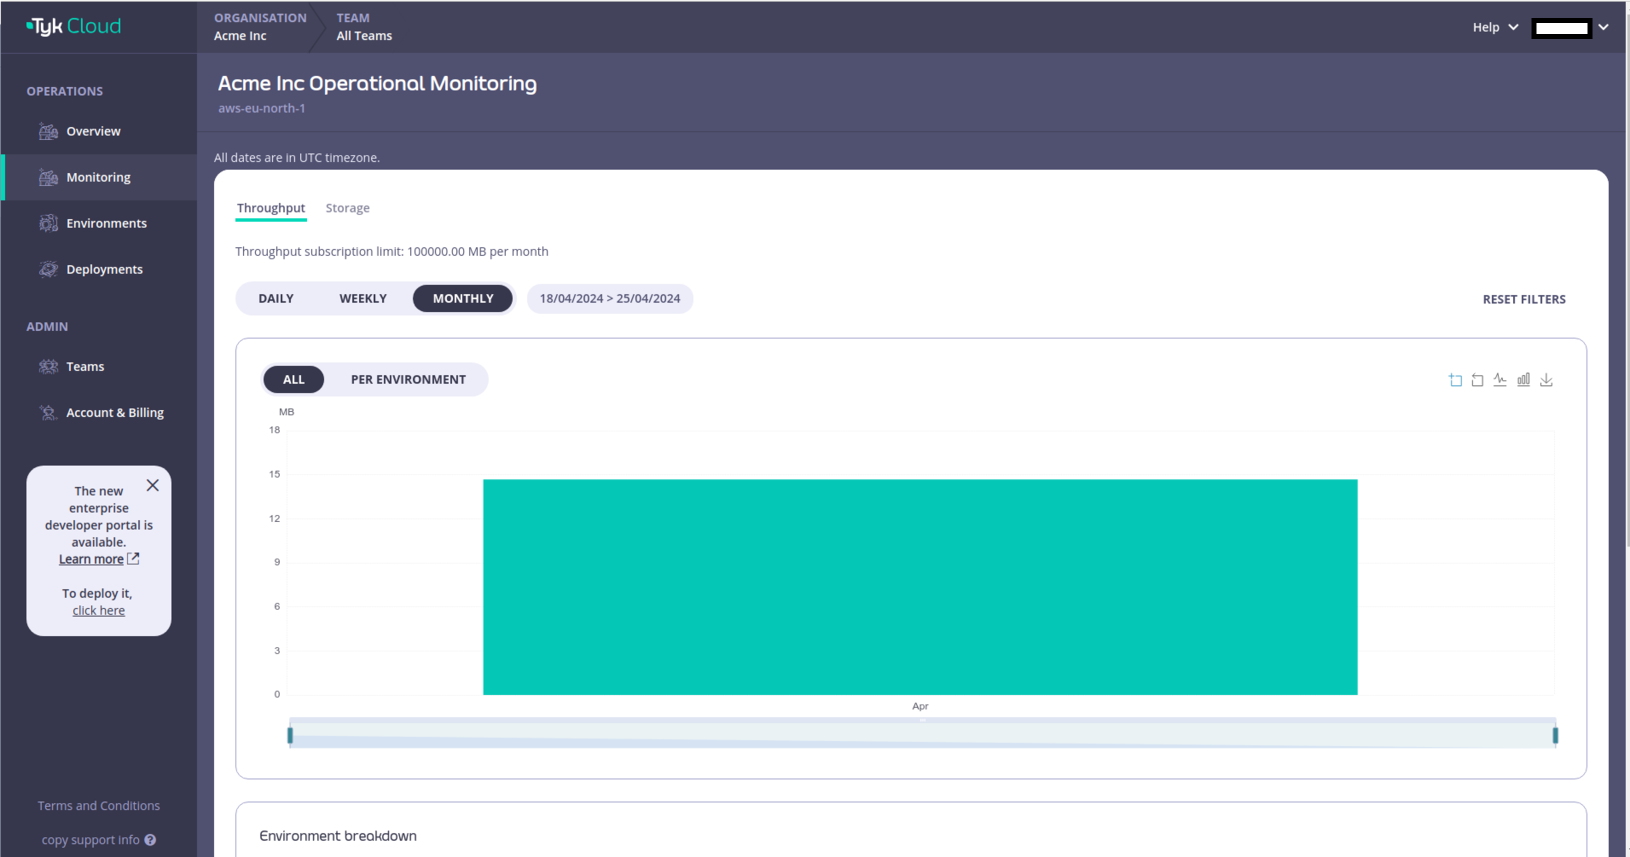
Tyk Cloud counts the total request/response sizes for traffic transferred through a deployment. Throughput metrics are displayed for the current day. These are calculated as the difference between the throughput usage at the current time and the throughput at last midnight. External traffic is subject to billing, while internal traffic is exempt. The monitoring service aggregates traffic between different services: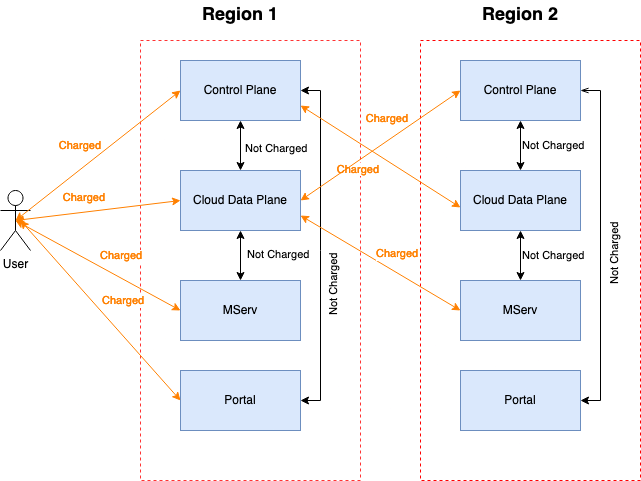
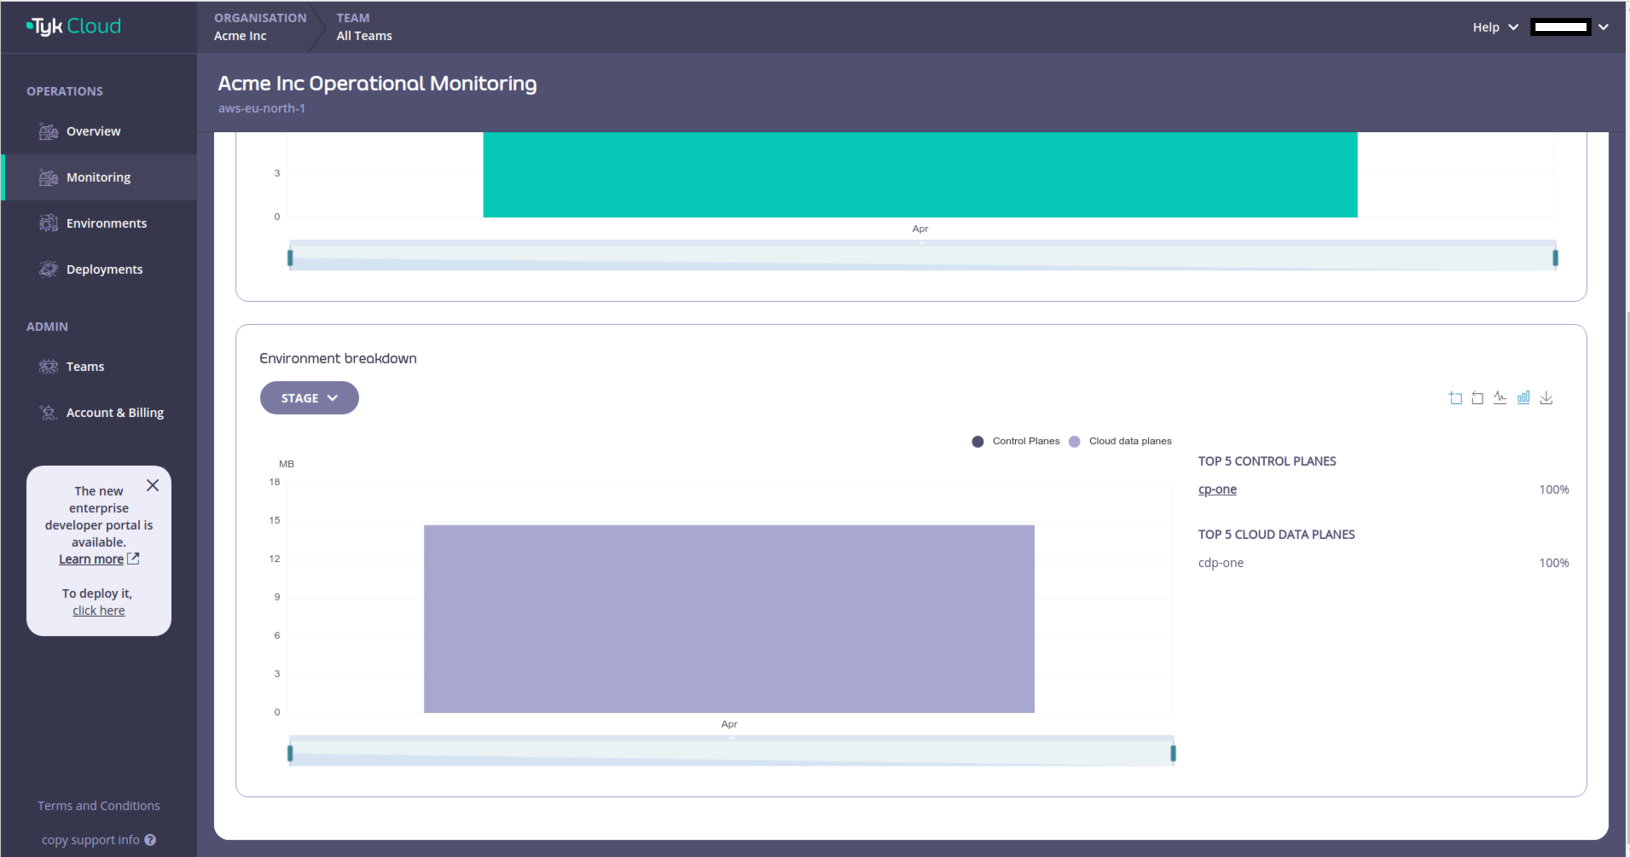
- Traffic between user → Control Plane
- Traffic between user → Cloud Data Plane
- Traffic between user → Enterprise Developer Portal
- Traffic between user → Mserv (plugin upload)
- Traffic between Control Plane → Cloud Data Plane cross region
- Traffic between Cloud Data Plane → Mserv cross region
- Traffic between Control Plane → Portal cross region
- Hybrid traffic is currently not counted
- Traffic between Control Plane → Cloud Data Plane in the same region
- Traffic between Cloud Data Plane → Mserv in the same region
- Traffic between Control Plane → Portal in the same region
Tyk Cloud Storage
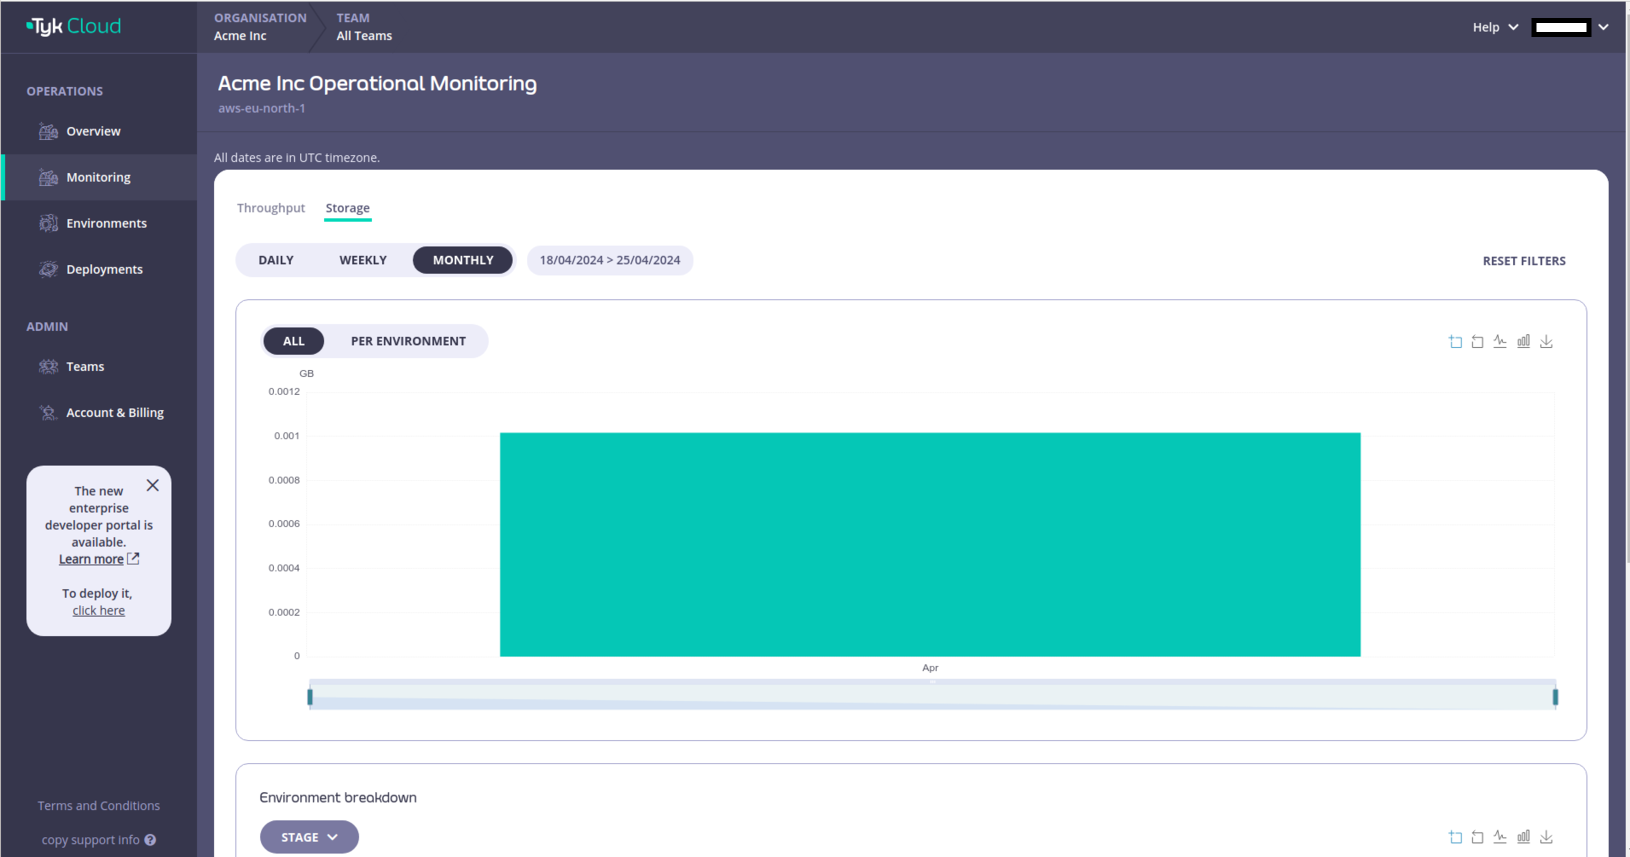
When a client makes a request to a Tyk Gateway deployment, the details of the request and response are captured and stored in Redis. Tyk Pump processes the records from Redis and forwards them to MongoDB. Finally, Tyk Cloud reads that data from MongoDB and displays its size(bytes) in the Storage section of Monitoring.Track Usage
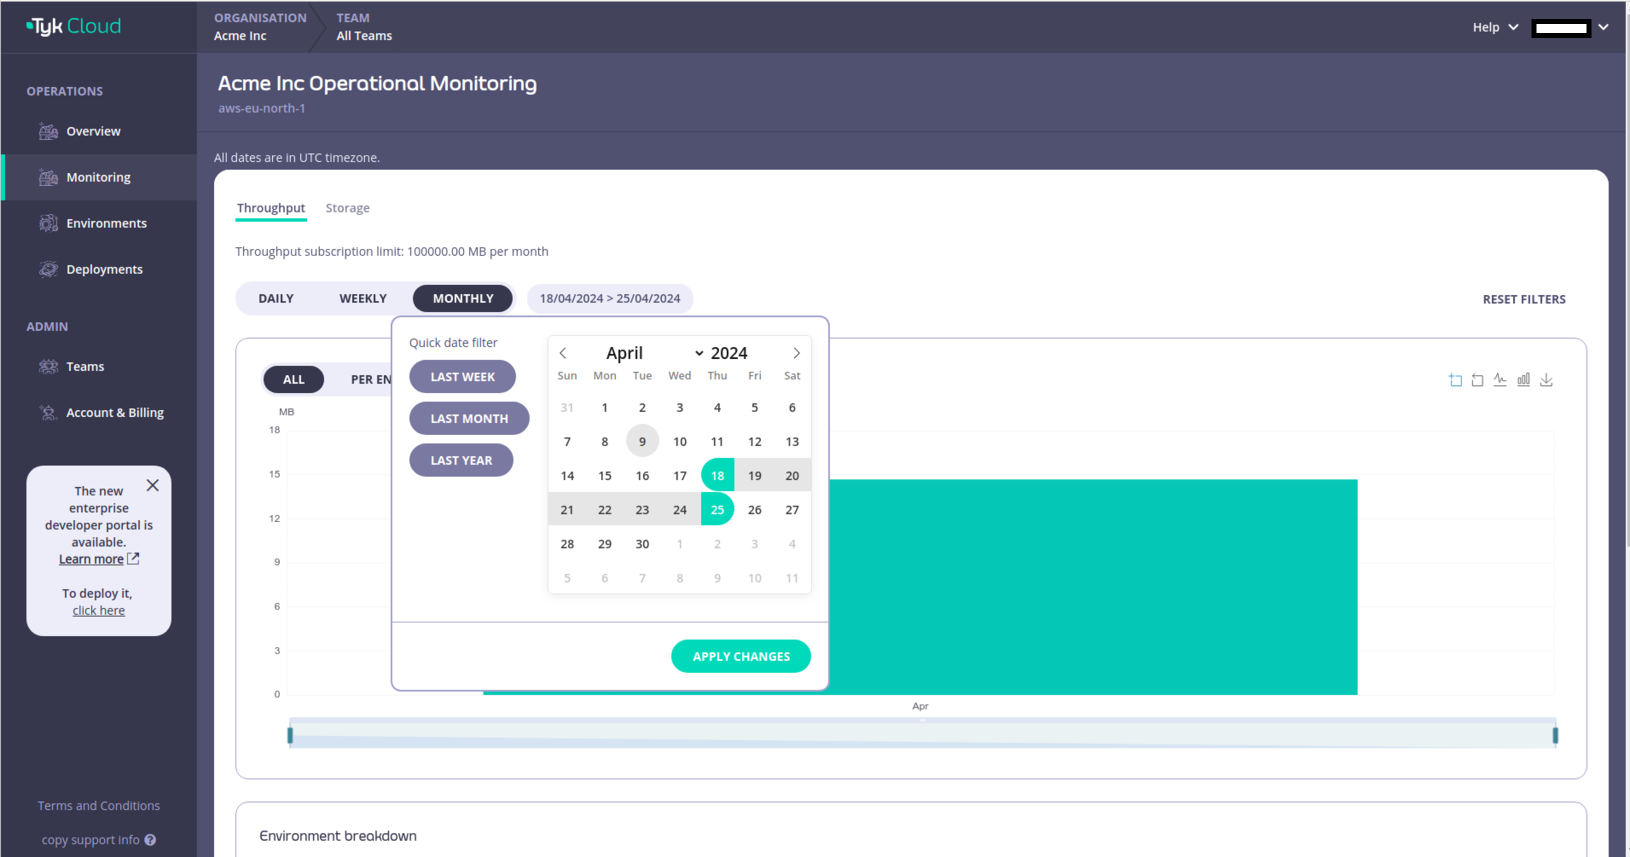
How to check metrics
Login to Tyk Cloud and click on Monitoring within the Operations menu. Enable Throughput to display throughput metrics.