Purpose
The Analytics System serves several key purposes:- Cost Tracking: Monitor spending associated with different LLM providers and models.
- Usage Monitoring: Understand how users and applications are interacting with LLMs and Tools.
- Performance Analysis: Track metrics like latency and token counts for LLM requests.
- Auditing & Debugging: Provide detailed logs of interactions for troubleshooting and security analysis.
- Reporting: Offer data points for dashboards and reports for administrators and potentially end-users.
Data Collection
The primary point of data collection is the Proxy & API Gateway. As requests flow through the proxy:- Request Details: Information about the incoming request is captured (e.g., user ID, application ID, requested LLM/route, timestamp).
- LLM Interaction: Details about the interaction with the backend LLM are recorded (e.g., model used, prompt tokens, completion tokens, latency).
- Cost Calculation: Using data from the Model Pricing System, the cost of the interaction is calculated based on token counts.
- Tool Usage: If the interaction involved Tools, relevant details might be logged (e.g., which tool was called, success/failure).
- Chat Context: For interactions originating from the Chat Interface, metadata about the chat session might be included.
Architecture
- Asynchronous Ingestion: To minimize impact on request latency, analytics data is typically collected by the Proxy and sent asynchronously to a dedicated analytics database or processing pipeline.
- Data Storage: A suitable database (e.g., time-series database like InfluxDB, relational database like PostgreSQL, or a data warehouse) stores the aggregated analytics records.
- API Endpoints: Tyk AI Studio exposes internal API endpoints that allow the Admin UI (and potentially other authorized services) to query the aggregated analytics data.
Key Metrics Tracked (Examples)
- Per LLM Request:
- Timestamp
- User ID / API Key ID
- LLM Configuration ID / Route ID
- Model Name
- Prompt Tokens
- Completion Tokens
- Total Tokens
- Calculated Cost
- Latency (ms)
- Success/Error Status
- Per Tool Call (if applicable):
- Timestamp
- Tool ID
- Success/Error Status
- Latency (ms)
- Aggregated Metrics:
- Total cost per user/application/LLM over time.
- Total requests per user/application/LLM over time.
- Average latency per LLM.
- Most frequently used models/tools.
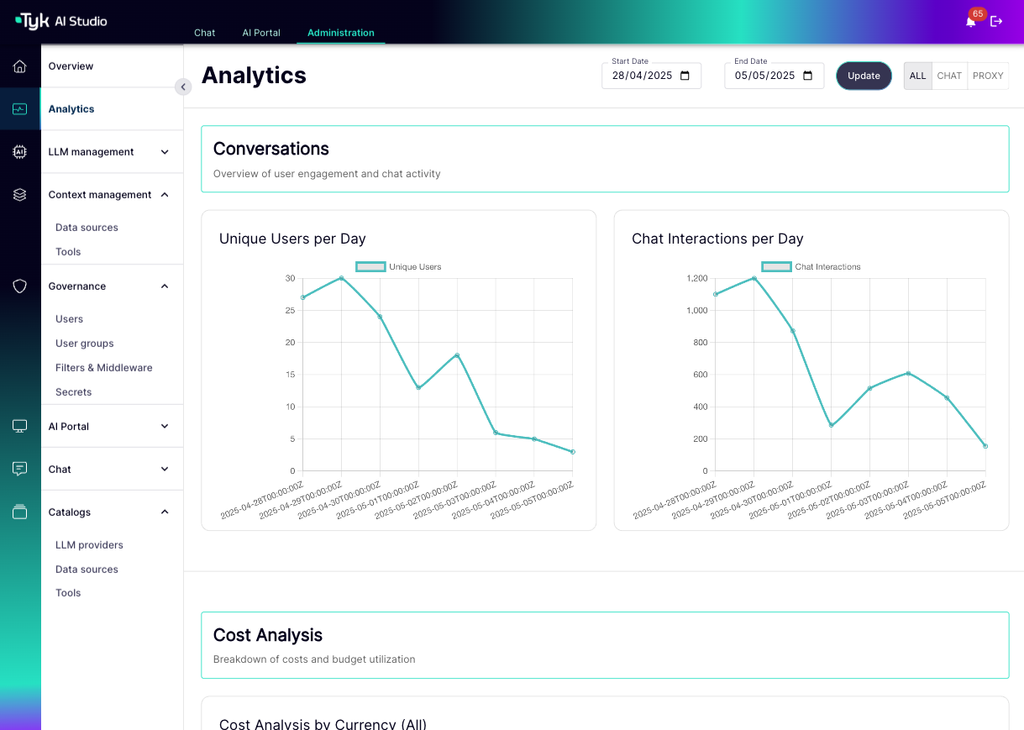
Monitoring & Dashboards (Admin)
Administrators typically access analytics data via dashboards within the Tyk AI Studio UI.- Overview: High-level summaries of cost, usage, and requests.
- Filtering & Grouping: Ability to filter data by time range, user, application, LLM configuration, etc.
- Visualizations: Charts and graphs showing trends in cost, token usage, request volume, and latency.
-
Detailed Logs: Access to raw or near-raw event logs for specific interactions (useful for debugging).
Integration with Other Systems
- Budget Control: Analytics data (specifically cost) is likely used by the Budget Control system to track spending against defined limits.
- Model Pricing: The pricing definitions are crucial for calculating the cost metric within the analytics system.